

What Is A Good Audience Retention Rate On YouTube?
There is no single good audience retention rate that fits every YouTube channel. The right benchmark depends on your video length, format, topic, traffic source, and how similar videos on your own channel usually perform. A good audience retention rate is really a comparison question, not a universal score. A two-minute tutorial, a twenty-minute review, and a one-hour livestream create different viewing behavior, so you shouldn’t judge them by one fixed percentage.
The more useful way to answer the question of which audience retention rate to aim for is to look for a pattern you can improve. If your recent how-to videos keep viewers longer than your older ones, that is progress even if another channel in a different niche posts different numbers. A healthy audience retention rate becomes clearer when you compare like with like and look for repeatable strengths in your own library.
- Use context-specific benchmarks. Compare videos with similar length, format, and audience intent.
- Read the graph, not just one metric. A retention curve shows where viewers stay, skip, leave, or rewatch.
- Separate formats. Shorts, long-form videos, and livestreams should be judged on different terms.
- Check traffic sources. Search viewers often behave differently from suggested, browse, or external viewers.
- Review the first seconds first. Many retention problems start with a weak opening or a mismatch between the promise and the delivery.
- Track average view duration and average percentage viewed together. One tells you time watched, the other tells you share watched.
- Make one change at a time. Test a tighter hook, clearer structure, or stronger thumbnail match before changing everything.
If you run a small or mid-size channel, this guide is built for that reality. You are not here for vague advice or a promise that one metric guarantees rankings, recommended videos, leads and customers, or ad revenue. You want to use YouTube Analytics to understand audience behavior, improve watch time, and make better videos that fit your niche, your business, and your viewers’ expectations.


What Do YouTube Audience Retention and Average View Duration Measure?
YouTube audience retention shows how much of a video people watch and where they continue, skip ahead, leave, or return. It is best understood as a timeline of viewer behavior. When you ask what counts as healthy retention, you are really asking how well your video keeps the right viewer engaged from opening to ending.
Three related metrics often get mixed together. Video retention rate usually refers to the overall share of the video watched. Average view duration is the average amount of time people spend watching. Average percentage viewed is the average share of the total video length watched. They point in the same direction, but they are not the same thing. A ten-minute video can have strong average view duration but a lower average percentage viewed than a shorter clip, simply because viewers spent more total time watching.
Watch time means the total amount of time viewers spend watching your videos. It gives valuable context beside retention. A longer video may lose viewers gradually yet still generate meaningful watch time. That is why what counts as a strong audience retention rate cannot be answered by percentage alone. Time watched matters, especially when you are comparing long-form educational content with short answer-based videos.
Audience engagement covers actions like likes, comments, shares, and subscriptions. These can support your reading of retention data, but they do not move in perfect sync. Some viewers quietly watch most of a video and never click anything. Others comment early and leave. High engagement can suggest the topic resonated, but it does not replace retention analysis.
You should also keep expectations realistic. Retention is one signal among many in the YouTube algorithm, search rankings, and recommended videos systems. Title clarity, video thumbnails, topic demand, viewer history, keyword optimization, satisfaction signals, and competition all matter too. So when you ask the question of which audience retention rate to aim for, treat it as one part of a broader channel-growth picture rather than a magic threshold.

What Counts as a Good Retention Rate by Video Length, Niche, and Format?
A good retention rate is one that performs well for that type of video and gives you a benchmark to beat on future uploads. There is no honest universal percentage that applies across every channel. When people ask what counts as healthy retention, the best answer is to compare similar videos on your own channel and use YouTube Studio comparisons where available.
Video length changes the meaning of retention. Short videos often have less time for viewers to drift away. Long videos naturally give viewers more points where they can pause, skip, or leave. That does not mean long videos are weak. A detailed product review or software tutorial can deliver lower average percentage viewed than a quick answer video while still producing stronger watch time and better business results.
Niche matters too. A fast how-to answer usually works best when the payoff comes early. A detailed product review may need setup, testing footage, and pros and cons before the final recommendation. A long interview may attract viewers who drop in for specific topics rather than watching straight through. That is why what counts as a strong audience retention rate has to be judged against viewer intent. If someone searches for “how to fix echo in a podcast mic,” they expect speed. If they click an in-depth camera comparison, they often expect more detail before the verdict.
Format differences are just as important.
- Shorts: Discovery often comes from the Shorts feed, and viewing behavior is fast and swipe-driven.
- Long-form videos: These are usually judged more by sustained interest across a clear structure.
- Livestreams: Viewers commonly join late, leave, and return, so retention patterns look very different from edited videos.
Audience demographics and viewing habits add one more layer. A local business explainer for busy homeowners may be watched in quick sessions on mobile. A B2B software tutorial may be watched on desktop during work hours. A younger entertainment audience may tolerate faster edits and stronger video hooks, while a coaching audience may prefer slower, clearer teaching. Even reference styles matter. For example, channels known for animations and concise storytelling, such as Kurzgesagt – In a Nutshell, train viewers to expect tight structure and visual clarity. Most small channels should not copy that style blindly, but they can learn from the principle: align pacing with expectation.
Your clearest action step is simple. Choose several comparable uploads. Note each video’s average view duration and average percentage viewed. Group them by topic, length, audience, and format. Then use the strongest recurring retention patterns as your working answer to the question of which audience retention rate to aim for for your channel right now.


How Do You Find and Compare Retention Reports in YouTube Studio?
You do not need advanced tools to start. YouTube Studio already gives you the main retention reports you need, but you have to compare the right videos and wait for enough data before making decisions. If you are trying to answer what counts as healthy retention, this is where the work actually happens.
- Open YouTube Studio. Go to your channel dashboard.
- Select Analytics. Start at the channel level if you want trends across content.
- Choose the relevant video or content type. Open a specific upload when you want detailed retention behavior.
- Find the audience-retention report. On a video-level view, open the retention graph when available.
- Review absolute audience retention. This shows what share of viewers remained at each moment in that specific video.
- Review relative audience retention. This compares your video’s performance with other YouTube videos of similar length.
- Compare similar uploads. Match by topic, length, format, and publishing context.
Absolute audience retention tells you where your own viewers stayed or left. Relative audience retention adds context by showing whether those moments performed better or worse than other videos of similar length on YouTube. Both are useful. If you only look at your own graph, you might overreact to a normal drop that happens on many videos. If you only look at relative comparisons, you may miss a recurring weakness in your opening.
Segmenting matters. Where reports provide it, check traffic source, device, new versus returning viewers, and other audience segments. A search viewer often arrives with a clear problem and wants a fast answer. A recommended-video viewer may be more open to a story-led opening. Mobile viewers may react differently from desktop viewers if small text, on-screen screenshots, or long intros slow the experience.
Give the data time. Early reports can be noisy. Low-view videos can create graphs that look dramatic without showing a stable pattern. Before you decide what counts as a strong audience retention rate for a specific format, wait until the sample is large enough to reflect real audience behavior rather than a few isolated sessions. Avoid changing your whole strategy based on one small spike or one weak upload.
While you are in Analytics, also check the Reach tab. That is where you will find impressions, which are the number of times YouTube showed your video to potential viewers, and click-through rate (CTR), which is the share of impressions that turned into views. If your channel has access, Test & Compare can help you evaluate thumbnail variations. It does not measure retention directly, but it helps you improve the match between your packaging and your actual content. That match is a big part of answering the question of which audience retention rate to aim for in a practical way.

How Do You Read Opening Drops, Dips, Spikes, and Rewatches?
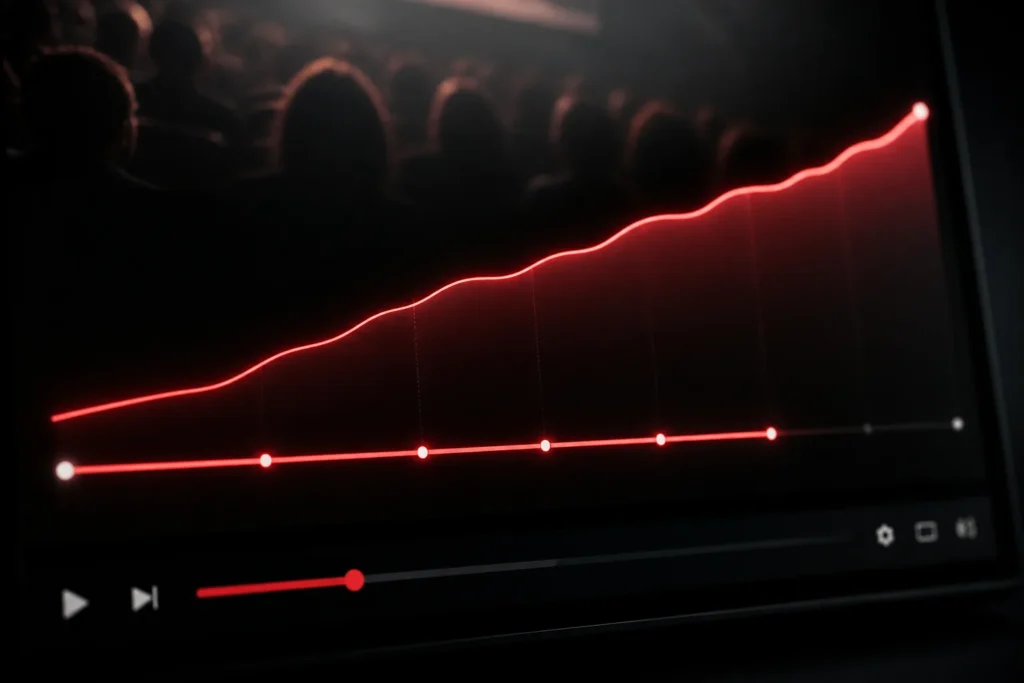
Your retention graph is a timeline of audience behavior. Instead of asking whether the whole video was good or bad, ask what each section made viewers do. That is often the fastest way to answer what counts as healthy retention for your content because the graph shows why people stayed or left.
An opening drop usually means viewers did not get the promised value fast enough, or the title and thumbnail set the wrong expectation. Start by reviewing the first seconds. Did you spend too long on a logo animation, a generic greeting, or a slow setup? Did your video hook clearly state the topic and payoff? If someone clicked because the thumbnail promised “3 fixes for blurry webcam video,” they should hear or see one useful detail almost immediately.
A dip often means viewers skipped or left at a certain point. Rewatch that exact moment and look for common problems:
- Repetition: You repeated a point the viewer already understood.
- Confusing transitions: The structure changed without a clear cue.
- Slow delivery: The answer arrived too late.
- Visual friction: Hard-to-read screens, weak B-roll, or dead air reduced momentum.
A spike can mean viewers replayed a segment or skipped ahead to it. Sometimes that is great. A spike around a demonstration, checklist, or side-by-side example often means the segment was useful. Sometimes it points to confusion. If people replay a complicated settings screen three times, they may be struggling to follow it. That is why what counts as a strong audience retention rate cannot be answered from one graph shape alone. You need to connect the graph to what happened in the video.
Rewatches deserve careful reading. A replayed section may signal value, confusion, or both. Check comments for clues. Did viewers say “I had to pause and copy those settings”? That is useful. Did they say “I got lost here”? That points to a scripting or editing problem. Compare the spike with retention right before and after it. If viewers return to a helpful moment and continue watching, the segment probably added value. If they rewatch and still leave right after, the explanation may need to be clearer.
Your best next move is concrete. Write down the timestamp, the likely viewer question, and one change to test in the next upload. That habit turns retention data into better videos, which is the real answer behind the question of which audience retention rate to aim for.

How Can You Improve Retention Without Hurting CTR?
You need both the click and the watch. CTR shows how often impressions became views. Retention shows what viewers did after clicking. If one is strong and the other is weak, your packaging or your content likely needs work. That balance matters whenever you ask what counts as healthy retention.
The biggest mistake is chasing clicks with a title or thumbnail that promises more than the video delivers. Clickbait may lift curiosity for a moment, but mismatched expectations often create a sharp opening drop. A dramatic thumbnail with huge text and a shocked face is not helpful if the opening meanders for thirty seconds before addressing the real topic. Good video thumbnails attract the right viewer, not just more casual clicks.
Use a simple workflow:
- Make the title specific. Name the result or problem clearly.
- Match the thumbnail to that promise. Show the outcome, tool, or before-and-after visually.
- State the payoff early. Confirm within the first seconds that the viewer is in the right place.
- Cut slow setup. Remove intros that do not serve the topic.
- Organize around viewer questions. Build the video in the order a viewer naturally needs answers.
- Review the retention graph after publishing. Check where the promise held and where momentum dropped.
Example: If your tutorial teaches creators how to improve home-office audio, a clear title might be How To Fix Echo In Your Home Office Mic. A matching thumbnail idea could show a microphone, a simple “Before / After” label, and visible foam or room treatment in the background. That setup does not guarantee a better CTR or better retention, but it sets the right expectation and attracts a viewer who actually wants the answer.
The first seconds deserve extra attention. Start with a clear topic, then give one immediate useful detail, then briefly explain what the viewer will get next. Avoid a long channel introduction before the promised answer. If you serve businesses, this matters even more because the right viewer may become a lead or customer later. Videos that respect the click build trust, and trust supports subscriber growth, community building, and repeat viewing over time.
When creators ask what counts as a strong audience retention rate, they often focus only on editing tricks. Editing helps, but alignment matters more. A truthful title, strong hook, and useful structure will usually do more for retention than a flashy opening that hides the real answer. That is the long-term way to improve the question of which audience retention rate to aim for on your channel without hurting CTR.
How Should Retention Guide Shorts, Long Videos, and Monetization Decisions?
You should evaluate Shorts, long-form videos, and livestreams separately because the viewing context is different in each case. If you apply one target across all three, you will misread your data. That is one reason what counts as healthy retention has no single universal answer.
Shorts often depend on fast hook strength, immediate clarity, and swipe behavior in the Shorts feed. Long-form videos rely more on structure, pacing, and whether each section earns the next minute of attention. Livestreams are different again because viewers join at different times, leave, and sometimes return later. A livestream can support community building even when its retention pattern would look weak next to an edited tutorial.
Retention and watch time should inform your content planning, but neither metric alone determines YouTube algorithm recommendations, search rankings, or recommended videos placement. YouTube uses multiple signals. Strong retention can help your case, but topic demand, viewer satisfaction, packaging, and audience fit still matter. So when you evaluate what counts as a strong audience retention rate, use it to guide decisions, not to declare a video successful or failed in isolation.
Monétisation needs the same level-headed approach. Better retention can increase viewing time and create more opportunities for ads to be shown, but it does not guarantee ad revenue. RPM means revenue per thousand views from your side as a creator. CPM means the advertiser’s cost per thousand ad impressions. Actual earnings vary by niche, audience location, season, ad demand, and viewer behavior.
There are also hard eligibility rules you need to know. According to the supplied YouTube Partner Program announcement dated August 10, 2026, until January 31, 2027, full ad revenue sharing requires 1,000 subscribers and either 4,000 public watch hours in the past 12 months or 10 million public Shorts views in the past 90 days. From February 1, 2027, new applicants need 1,000 subscribers and either 8,000 watch hours in the past 12 months or 20 million Shorts views in the past 90 days. Channels already in YPP keep their status.
Two more details matter. Shorts feed views do not count toward watch hours. The fan funding and Shopping tier remains at 500 subscribers plus either 3,000 watch hours or 3 million Shorts views. Also, since October 1, 2026, the Shorts feed gives less reach to re-uploaded content without meaningful changes. Since August 24, 2026, public view counts start from the first frame, while earnings and YPP eligibility still use engaged views.
If you are planning content around monetization, use retention as a planning signal. Ask which format helps you hold the right viewer’s attention, build subscriber growth, and support your business goals. That is a smarter use of the question the question of which audience retention rate to aim for than chasing one number across every format.

What Should You Change After Reviewing Your Retention Data?
After you review retention, do not rewrite your entire channel strategy overnight. Pick one comparable video, inspect the retention graph, identify the largest meaningful drop or spike, check its traffic source and audience segment, and choose one change to test in the next upload. That disciplined process is the most useful answer to what counts as healthy retention because it turns analytics into repeatable improvement.
Keep a simple record for each test. You can use a spreadsheet with these columns:
- Topic
- Format
- Durée du vidéo
- Average view duration
- Average percentage viewed
- CTR
- Main drop or spike timestamp
- Traffic source
- Change tested next time
Compare like with like. If you change the title style, thumbnail style, opening script, pacing, and topic all at once, you will not know what actually helped. A better approach is to test one improvement at a time. For example, keep the topic and format similar, but shorten the intro and move the first practical tip into the opening. On the next comparable upload, review whether that change improved the early graph.
If you want outside help, DigiSphere’s work is built around this kind of YouTube growth analysis. Its services include SEO vidéo YouTube, design miniatures, YouTube Shorts creation, Google Ads video promotion, backlinks, and Social Media Ring video sharing for authority signals. These are services that can support channel growth, not guaranteed retention or ranking outcomes. If you need a second opinion on packaging, audience targeting, or keyword optimization, a channel audit can also help you spot patterns you may miss on your own.
The bigger takeaway is simple. Your audience retention rate is not a fixed badge you either earn or miss. It is a moving benchmark shaped by your audience, topic, length, and format. Use retention to tighten your first seconds, improve clarity, and match the promise of your title and thumbnail more accurately. Those changes compound over time.
If you want a low-pressure outside review, you can request a free YouTube channel audit from DigiSphere at digispheresl.com. DigiSphere is led by Michael, a Fiverr Top Rated Seller, with 15+ ans en marketing digital, 10,000+ completed orders, 5 000+ avis cinq étoiles, and 6,000+ YouTube creators optimized. If you already have data but want clearer next steps, that kind of audit can help you decide what to test next without promising results that nobody can honestly guarantee.

Principaux éléments à retenir
- A good retention rate is contextual, so compare videos by similar length, topic, format, and audience rather than chasing one universal percentage.
- Read retention graphs closely because opening drops, dips, spikes, and rewatches often reveal clearer fixes than one summary metric alone.
- Use average view duration, average percentage viewed, watch time, and CTR together to understand both the click and the viewing experience.
- Judge Shorts, long-form videos, and livestreams separately because viewer behavior and monetization paths differ across formats.
- Track one change at a time, record the result, and use retention data to improve your next upload rather than trying to optimize everything at once.
- Compare your audience retention rate with your own past videos of the same format, not with generic benchmarks.
Foire aux questions
Combien de YouTube vues faut-il pour atteindre $10 000 par mois ?
There is no fixed view count that guarantees $10,000 a month. Earnings depend on RPM, audience location, niche, ad demand, video length, and how your monetization mix is set up. A finance or software channel may need far fewer views than an entertainment channel with lower ad rates.
Is 3% CTR on YouTube good?
A 3% CTR can be perfectly fine depending on your traffic source, topic, and how broadly YouTube is testing the video. Browse and suggested traffic often behave differently from search traffic. Judge it beside retention, impressions, and how similar videos on your own channel usually perform.
Is a 2% CTR bad?
Not always. A 2% CTR may be weak for one video but normal for another, especially if YouTube is showing it to a broader audience that is less targeted. Check whether the title, thumbnail, and opening all match the viewer’s expectation before deciding the packaging failed.
What is YouTube's average engagement rate?
There is no single average engagement rate that applies to every channel or niche. Engagement varies widely by audience size, format, and topic. Use likes, comments, shares, and subscriptions as supporting signals, but read them alongside retention and watch time rather than in isolation.
Does higher audience retention guarantee more recommended views?
No. Higher retention can help, but YouTube recommendations use multiple signals, including viewer satisfaction, topic relevance, click behavior, and audience fit. Strong retention improves your case, but it does not guarantee broader distribution.




 English
 Español
 Deutsch
 Français
 Italiano
 العربية